How does Mercuria Energy Group Ltd. operate as a global energy trader and what drives its profitability?
Mercuria Energy Group Ltd. sources, trades, stores, and ships oil, gas, power, and emissions to balance global supply and demand. Its model matters because volatility and geopolitics in 2025 pushed trading margins higher, while physical logistics and storage arbitrage drove cash returns.
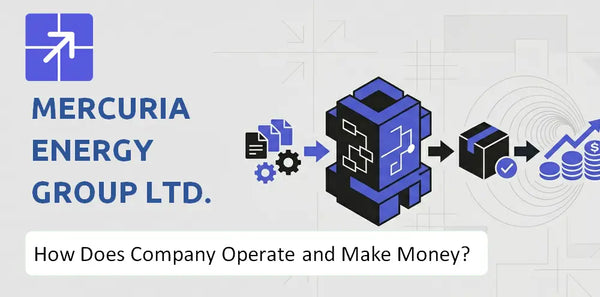
Focus on asset-light trading plus strategic storage and freight positions; scale and risk management enable capture of price dislocations. See strategic product study: Mercuria Energy Group Ltd. BCG Matrix Analysis
What Does Mercuria Energy Group Ltd. Actually Sell?
Mercuria Energy Group Ltd. sells physical delivery of energy and raw materials and bundled risk-management services; customers pay for guaranteed volumes at set locations and prices plus hedging and logistics. Main products include crude oil, refined fuels, natural gas, power, coal, iron ore, and growing environmental products like carbon credits and biofuels.
Mercuria Energy Group sells crude oil, refined petroleum products, LNG and pipeline natural gas, power contracts, coal, and iron ore alongside storage, shipping, and trading platforms. In the 2025/2026 cycle the firm expanded environmental products – carbon credits, biofuels, and renewable energy certificates – lifting low – carbon revenues.
Buyers are oil majors, utilities, refiners, industrial consumers, airlines, traders, and investment funds seeking commodity exposure or hedges. Governments and corporates also purchase environmental products for compliance and voluntary ESG programs.
Customers receive guaranteed delivery of specified volumes to agreed locations at fixed prices – time and place utility – reducing exposure to price swings and logistical risk. Ancillary value comes from hedging, credit intermediation, and physical logistics like storage and chartered shipping.
Mercuria business model blends large-scale physical flows with sophisticated energy trading strategies and risk management, backed by storage terminals and shipping access. In 2025 Mercuria increased environmental product sales and reported material trading volumes – supporting diversified revenue across oil, gas, power, and low – carbon markets; see Growth Outlook of Mercuria Energy Group Ltd. Company for context.
Mercuria Energy Group Ltd. SWOT Analysis
- Complete SWOT Breakdown
- Fully Customizable
- Editable in Excel & Word
- Professional Formatting
- Investor-Ready Format

How Does Mercuria Energy Group Ltd. Run Its Business Day to Day?
Mercuria Energy Group Ltd. runs daily as a global arbitrage and asset-optimization business: trading desks scan price spreads 24/7, while logistics teams move, store, and blend hydrocarbons to capture timing and location value. Delivery flows span chartered tankers, pipelines, and storage terminals, supported by real-time market data, risk systems, and integrated upstream/downstream operations.
Operating model: market-driven arbitrage and asset-backed trading
Desks monitor physical and paper markets to spot geographic, intertemporal, and product-form spreads; trades execute across crude, products, natural gas, and LNG. Risk and P&L systems settle intraday positions, while operations coordinate cargo nominations, nominations to pipelines, and customs/terminal paperwork in real time.
Product delivery: blended, scheduled, and contract-driven flows
Customers receive supply via spot sales, term contracts, or tolling agreements; Mercuria arranges physical delivery using chartered tankers, terminal lifts, and pipeline bookings. Blending teams adjust product specs to meet regional fuel standards before vessel discharge or refinery feedstock delivery.
Production and sourcing: integrated upstream linkages
Mercuria sources cargoes from owned upstream fields, third-party producers, and spot markets; it secures feedstock via long-term supply and short-term purchases. For 2025, the firm's combined physical sourcing and trading enabled management of multi-million-barrel monthly flows across crude and refined products.
Sales channels: bilateral contracts and exchange-linked trading
Sales use direct corporate contracts, refinery and utility agreements, and exchange-cleared time spreads; proprietary trading teams also hedge via futures and options on major exchanges. Digital portals and trader networks handle nominations, invoicing, and compliance checks.
Key assets and partnerships: storage, shipping, and terminals
Core assets include owned and leased storage terminals, pipeline access, and a fleet of chartered tankers plus long-term shipping contracts; strategic partnerships with refineries and ports extend reach. These assets let Mercuria capture basis differentials and store when markets are oversupplied.
What makes it work: integration, speed, and data
Integration across upstream production, trading, and downstream distribution gives real-time intelligence feeding high-frequency decisions; quantitative models, low-latency feeds, and firm-wide risk limits enable rapid execution. See the Sales and Marketing Strategy of Mercuria Energy Group Ltd. Company for channel detail: Sales and Marketing Strategy of Mercuria Energy Group Ltd. Company
Mercuria Energy Group Ltd. Business Model Canvas
- One-time Payment
- No Research Needed – Save Hours of Work
- Built by Experts, Trusted by Consultants
- Instant Download, Ready to Use
- 100% Editable, Fully Customizable

How Does Revenue Flow Through Mercuria Energy Group Ltd.?
Mercuria Energy Group drives revenue by moving vast commodity volumes and capturing small spreads, plus fees from logistics and returns on infrastructure investments. Demand converts to cash through large revolving credit lines that finance global physical flows and arbitrage trades.
Mercuria Energy Group earns most revenue by buying and selling oil, gas, and refined products across markets, capturing thin spreads on massive turnover. For fiscal 2025 the firm recorded annual revenues in the range of $140 billion to $160 billion, driven by scale and market access.
Fee-based services – storage, shipping, bunkering, and trading execution – add stable margin, while equity and project investments in terminals, pipelines, and renewables deliver longer-term returns. These activities diversify the Mercuria business model and reduce reliance on trading spreads.
Revenue comes from captured arbitrage (buy low, sell high), contractual logistics fees, and ROI from owned assets. The firm leverages revolving credit facilities commonly exceeding $15 billion to fund physical trades and optimize working capital across markets.
Key drivers are traded volume, commodity price differentials (volatility creates arbitrage), and access to large credit lines that enable continuous physical flows. Effective risk management and hedging practices keep thin-margin trading profitable at scale; see related analysis on Ownership and Control of Mercuria Energy Group Ltd. Company.
Mercuria Energy Group Ltd. Marketing Mix
- Complete Marketing Mix Analysis
- Effortlessly Communicate Your Business Strategy
- Investor-Ready Format
- 100% Editable and Customizable
- Clear and Structured Layout

What Makes Mercuria Energy Group Ltd.'s Model Sustainable or Fragile?
Mercuria Energy Group Ltd. shows sustainability through diversified energy trading and a pivot to low – carbon investments, with over 50 percent of new investments allocated to renewables and low – carbon tech by 2025; fragility stems from sensitivity to sharp interest – rate spikes and abrupt carbon – market regulation changes, plus geopolitical risk that can both create profits and threaten assets.
Mercuria Energy Group's diversified portfolio across crude, natural gas, LNG, refined products, and growing renewables reduces dependency on oil demand cycles. The move to allocate over 50 percent of new capital to low – carbon energy by 2025 materially lowers long – run oil exposure and supports resilient cash flows from energy trading strategies.
Large physical assets – storage terminals, shipping chartering capacity, and global trading desks – enable Mercuria Energy Group to capture basis and time – spread opportunities. Advanced risk management, proprietary analytics, and deep counterparty networks sustain high – frequency commodities trading and execution in volatile markets.
The business depends on accessible short – term financing and stable repo/credit markets; extreme spikes in interest rates raise financing costs for trades and working capital, compressing margin. Sudden regulatory shifts in carbon markets or sanctions can impair trading flows and expose physical assets to seizure. Commodity price concentration and counterparty credit remain structural constraints.
For 2026 the outlook is stable to positive: Mercuria Energy Group has shown ability to operate through high – interest – rate regimes while preserving liquidity to exploit market dislocations. Still, the model is exposed to abrupt policy shocks in carbon regulation and acute geopolitical events; prudent liquidity buffers and hedging of interest – rate and regulatory risk will determine durability.
Target Customers and Market of Mercuria Energy Group Ltd. Company
Mercuria Energy Group Ltd. Boston Consulting Group Matrix
- Built by Experts, Trusted by Consultants
- Structured for Consultants, Students, and Founders
- 100% Editable in Microsoft Word & Excel
- Instant Digital Download – Use Immediately
- Compatible with Mac & PC – Fully Unlocked

Related Blogs
- What Is the History of Mercuria Energy Group Ltd. Company and How Did It Evolve?
- What Is the Competitive Landscape of Mercuria Energy Group Ltd. Company and How Does It Compete?
- What Is the Growth Outlook of Mercuria Energy Group Ltd. Company and Where Is It Heading?
- How Does Mercuria Energy Group Ltd. Company Reach Customers and Turn Demand into Sales?
- What Do the Mission, Vision, and Core Values of Mercuria Energy Group Ltd. Company Reveal?
- Who Are the Core Customers in Mercuria Energy Group Ltd. Company's Target Market?
- Who Owns Mercuria Energy Group Ltd. Company Today and Who Holds Control?
Frequently Asked Questions
Mercuria Energy Group Ltd. sells physical energy and raw materials, plus risk-management services. Its mix includes crude oil, refined fuels, LNG and pipeline natural gas, power contracts, coal, iron ore, and environmental products such as carbon credits, biofuels, and renewable energy certificates.
Disclaimer
All information, articles, and product details provided on this website are for general informational and educational purposes only. We do not claim any ownership over, nor do we intend to infringe upon, any trademarks, copyrights, logos, brand names, or other intellectual property mentioned or depicted on this site. Such intellectual property remains the property of its respective owners, and any references here are made solely for identification or informational purposes, without implying any affiliation, endorsement, or partnership.
We make no representations or warranties, express or implied, regarding the accuracy, completeness, or suitability of any content or products presented. Nothing on this website should be construed as legal, tax, investment, financial, medical, or other professional advice. In addition, no part of this site - including articles or product references - constitutes a solicitation, recommendation, endorsement, advertisement, or offer to buy or sell any securities, franchises, or other financial instruments, particularly in jurisdictions where such activity would be unlawful.
All content is of a general nature and may not address the specific circumstances of any individual or entity. It is not a substitute for professional advice or services. Any actions you take based on the information provided here are strictly at your own risk. You accept full responsibility for any decisions or outcomes arising from your use of this website and agree to release us from any liability in connection with your use of, or reliance upon, the content or products found herein.